


4 February 2020
Manulife US REIT: Life After Entering the Index

In 2019, many S-REITs have announced their entry into an index. Among them is Manulife US REIT (BTOU.SI) which announced on 5 Dec 2019 that it will be included in the FTSE EPRA Nareit Global Developed Index with effect from 23 Dec 2019. This announcement propelled Manulife US REIT’s stock price from 97c just prior to the announcement to a historical high of US$1.08 – a gain of 11.3% in less than two months. It presently trades at US$1.06 at time of writing.
Over the course of a year, Manulife US REIT recorded a price appreciation of 38.2% (from US$0.7671 to US$1.06) and a total shareholder return of 42.1%, outperforming the FTSE ST REIT Index's price appreciation of 18.8% and total shareholder return of 25.5%. Based on analysts' consensus, Manulife US REIT's dividend yield was 6.0% for FY2019.
Was the outperformance of Manulife US REIT related to the inclusion in the index or was it simply regular market forces in line with the rise in the broader S-REIT market? In this article, we examine this question and find out if there is indeed an index effect on stocks using Manulife US REIT as the central case study.
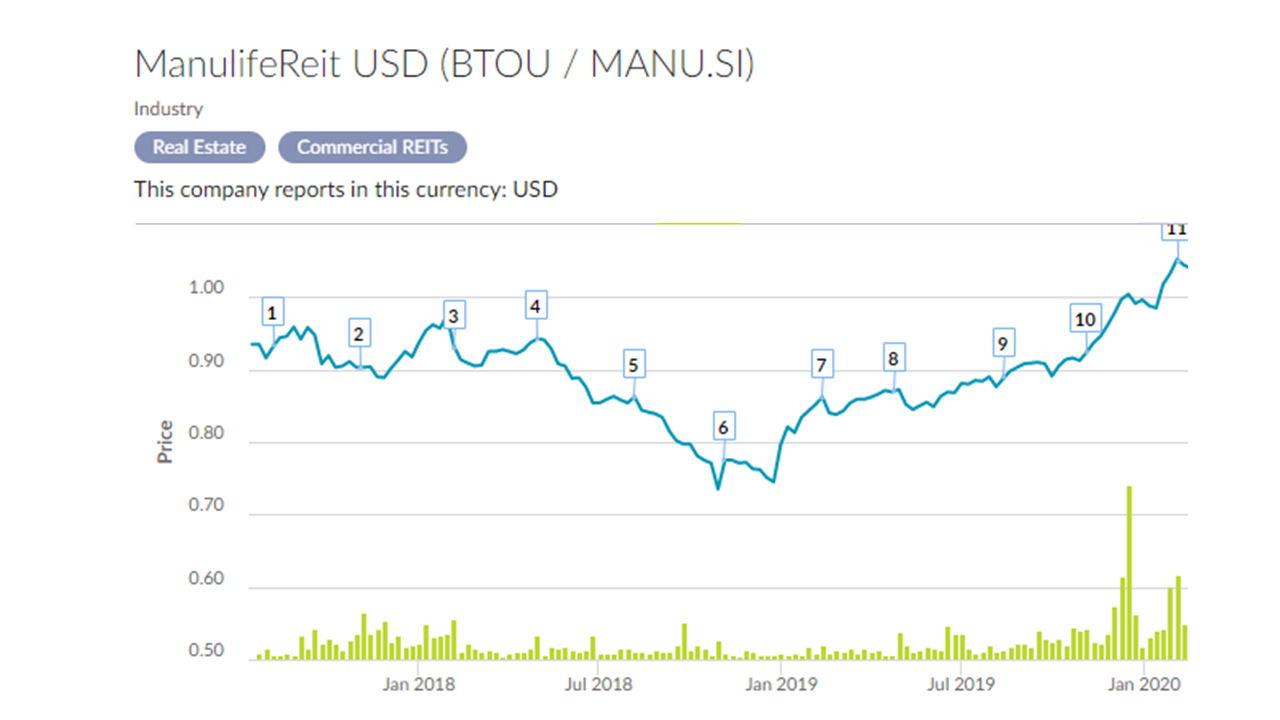
Source: SGX
What is an Index?
An index is a portfolio of stocks that provides a representative portfolio holding of a specific sector of the stock market that the index seeks to represent.
As indexes are meant to gauge the movements of a particular stock market sector, the component stocks selected for inclusion into the index needs to be representative of the sector. The component stocks that make up the index are allocated according to a ratio, most commonly using the market-cap method. Besides market-cap, some indexes utilise revenue weightings, float weightings or could simply use equal weightings as a methodology to allocate the ratio of the various components. The larger a stock’s weightage on the index, the larger the significance in its stock price movements will have on the index.
In order to limit the impact of any one single large stock, many indexes may place a limit on the weights, for example no more than 10%.
Major indexes typically represent the largest, most popular or most liquid stocks listed on the respective market – for example, the Singapore Straits Times Index (STI) or the Dow Jones Industrial Average (Dow). Both these indexes use market-cap weighted allocation of the top 30-largest stocks on the Singapore and US market, respectively. These stocks are generally known as blue chips, named after the colour of the poker chips that represent the highest denominations.
Indexes are frequently used as a performance measure of the broad stock market such as the S&P 500, MSCI Singapore Index or the FTSE ST Large & Mid Cap Index. The S&P 500 components are made up of the top-500 largest market-cap stocks on the US market while the FTSE ST Large & Mid Cap Index represents approximately 86% of the Singapore market capitalisation. Both indexes derive their components from the stocks that are deemed to be of a certain size with adequate liquidity within their respective markets. Liquidity is a measure of the average amount of transactional volume a stock clocks on its respective market over a period of time.
Indexes could also be used as a benchmark of a specific sector within the stock market. For example, the FTSE ST REIT Index, MSCI US REIT Index and the FTSE EPRA Nareit Global REIT Index are used as the benchmark indexes to gauge the performance of the Singapore REIT, US REIT and the global REIT markets. The latter is a REIT Index jointly developed by the European Public Real Estate Association (EPRA) and the National Association of Real Estate Investment Trusts (NAREIT). It tracks globally listed REITs which are deemed to be less correlated to the broader equity market and typically pay consistent dividends.
The very first stock market index was the Dow Jones Industrial Average. Created by the editor of "The Wall Street Journal" and founder of Dow Jones & Co. – Charles Dow in 1896, the intention behind the Dow was to provide investors an easy way to measure the performance of the overall stock market.
How Indexes Are Used
Indexes are usually a representative basket of stocks whose collective gains and losses closely reflects the general gains and losses of a stock market sector.
The most common use for an index is as a benchmark of the stock market sector that it was designed to track. These indexes are frequently reported in the media as quoted by analysts on how a specific sector is faring. Media and analysts usually seek to explain the daily movements of these indexes based on the geopolitical and economic events that have taken place throughout the day.
Another use of the index is to measure performance of a managed portfolio against the broad market sector. For example, fund managers who are tasked with the duty of picking the best quality stocks for their client will benchmark their portfolio picks against a representative index to measure out-performance or under-performance. Performance measure of a managed portfolio is frequently quoted in percentage terms how much the portfolio had out-performed or under-performed the benchmark index.
In recent years, indexes are also popularly used by fund managers to construct Exchange Traded Funds or ETFs for short. ETFs are investment funds which are listed and traded on a stock exchange and its portfolio is typically made up of the stocks in the same ratio as the established index that it tracks. ETFs are similar to unit trusts which is an investment vehicle most people are familiar with. ETFs however differ from unit trusts in that they are traded over an exchange and therefore can be bought and sold quickly throughout the day while the market is open.
ETF portfolios which are constructed around indexes provide investors with opportunities to invest in a diversified basket of stocks with exposure to the specific stock market sector. Since shareholders are also asset owners, they are entitled to the share of the profits which are generated by these underlying assets such as interest, dividends and distributions if the assets are sold. As a result, these ETFs do not require any form of active fund management and passively track the index. These ETFs are also known as passive funds.
About the FTSE EPRA/NAREIT Global Real Estate Index Series
The FTSE EPRA Nareit Global Real Estate Index Series is designed to represent the general trends in listed real estate stocks worldwide.
The FTSE EPRA Nareit Global Real Estate Index Series provides investors with a comprehensive and complementary set of indexes which range from regional and country indexes, to Dividend+ indexes, Investment Focus indexes and a REITs and Non-REITs series. The index series is designed to reflect the stock performance of companies engaged in specific aspects of the major real estate markets/regions of the world - Americas, EMEA and Asia Pacific.
The FTSE EPRA Nareit Global Real Estate Index Series includes the indexes which can be grouped into global, regional and specialist. The FTSE EPRA Nareit Global Real Estate Index Series is broken down into two indexes:
- Global Index
- Global ex-US Index
For the regional series, various indexes are introduced to track the real estate sector of specific regions including:
- Americas
- Asia Pacific (including Australia and New Zealand)
- Europe, the Middle East and Africa (EMEA)
The above global and regional indexes are further broken down into Developed and Emerging as well as REIT and non-REIT sub-categories. Real estate stocks including REITs that are listed in Singapore are classified as Developed.
To qualify for inclusion into this index series, several criteria must be met, most notably, they must:
- Be publicly listed on a stock exchange (e.g. Pte Ltd, LLP, LP, MLP, LLC or BDC would not qualify) excluding investment holding companies and those on surveillance by their respective stock exchanges
- Be core business, classified using the Industry Classification Benchmark (ICB) as real estate, heavy construction and home construction
- Publish audited annual reports in English
- Derive at least 75% of EBITDA from relevant real estate activities
- Have a minimum size of 0.3% of the regional free float market cap for Developed Asian stocks (0.1% for Developed EMEA and Americas stocks)
- Have a minimum liquidity with a turnover of at least 0.05% of their shares in issue based on their median daily trading each month
- Have a minimum free float of 5%
Since Manulife US REIT is a REIT listed in Singapore and has met the numerous stringent criteria to be included into the series, it would be added in a variety of indexes within the series such as the Global Index, Global ex-US Index, Global Developed Index, Global Developed REIT Index, Asia Pacific Developed Index and Asia Pacific Developed REIT Index and so on.
While Manulife US REIT may be included in multiple indexes within the series, not all indexes necessarily have ETFs tracking them. There are many ETFs that utilise indexes within the FTSE EPRA Nareit Real Estate Index Series. Some examples are quoted here:
- iShares Global REIT ETF (REET) tracking the FTSE EPRA/NAREIT Global REIT Index with a weightage of 0.10%
- AMUNDI INDEX FTSE EPRA NAREIT GLOBAL - UCITS ETF DR (EPRA) tracking the FTSE EPRA/NAREIT Developed Index with a weightage of 0.08%.
- Lyxor FTSE EPRA/NAREIT Global Developed UCITS ETF - Dist (MWO) tracking the FTSE EPRA/NAREIT Global Developed Index with a weightage of 0.10%.
- HSBC FTSE EPRA/NAREIT DEVELOPED UCITS ETF (HPRO) tracking the FTSE EPRA/NAREIT Developed Index with a weightage of 0.08%.
- iShares International Developed Real Estate ETF (IFGL) tracking the FTSE EPRA/NAREIT Developed Real Estate ex-U.S. Index with a weightage of 0.18%
- First Trust FTSE EPRA/NAREIT Developed Markets Real Estate Index Fund (FFR) tracking the FTSE EPRA/NAREIT Developed Index with a weightage of 0.08%.
Each of these passive funds manages several hundreds of millions to billions of dollars’ worth of real estate related stocks. REET is the largest of the ETFs tracking the FTSE EPRA/NAREIT index series with an Asset Under Management (AUM) of US$2,010 million at the time of writing. Given the weightages of Manulife US REIT to the REET ETF, it is estimated that US$2.01mil (S$2.71mil) worth of shares need to be purchased by just this single ETF alone due to the recent index inclusion!
Besides the passive funds, many active fund managers and investors may also be purchasing the shares ahead of the index inclusion resulting in higher transactional volumes. Fund managers tend to favour investing in shares which are also major index constituents as they would have been tested for minimum liquidity criteria. Liquidity is an important investment criterion for funds as they frequently need to acquire or divest stocks when their clients park or redeem their funds. Without sufficient liquidity, the fund manager may be stuck due to insufficient buyers or sellers. Liquidity ensures that their investments can be easily acquired or divested at any moment.
Understanding the Impact of Stock Inclusions into Established Indexes
ETFs were introduced as a response from research and statistics that appear to show that a good number of actively managed unit trusts do not outperform the market index. Therefore, instead of actively trying to manage and outperform the markets which many fail to do, why not just track the market indexes instead? As a result, many ETFs were birthed with that specific purpose in mind, to track and replicate the performance of the particular underlying index. ETFs tracking an index would therefore in theory reflect the same percentage gain or loss of the index.
Take for example an established index such as the FTSE EPRA Nareit Global REIT Index. It has established ETFs tracking it such as the iShares Global REIT ETF (REET) which boasts an AUM of close to US$2.0 billion. The index is made up of 312 REIT stocks at the time of writing with REITs spanning the globe in the major REIT markets around the world such as the US, Canada, Europe, Hong Kong, Australia, Singapore, Japan and South Korea.
A REIT that is included into the FTSE EPRA Nareit Global REIT Index is a worldwide recognition that the REIT is well established and widely followed in its home country – meeting various free float, liquidity and size criteria.
When the underlying index constituents change, these ETFs would be notified by the index provider and given advance notice of when the changes take effect, giving these passive indexes ample time to adjust their portfolios. Removal of constituents would result in a divestment while an inclusion will result in acquisitions of the stock.
Using Manulife US REIT as a case study, we will observe the impact on trading volume prior, during and after the index inclusion.
We found that since IPO in May-2016, Manulife US REIT had an average daily volume turnover of 1,836,265 shares and a median of 1,110,499 shares. In the last 15 months, the average and median daily volume turnover was 2,260,849 and 1,271,377 respectively. Given the increase in the figures since IPO compared to the last 15 months, it shows that transaction volumes have picked up – potentially indicating a larger investment following for this REIT.
We plotted a chart of the daily trading volume of Manulife US REIT by month for the last 15 months so that we can observe how the volume trends have changed over the months. We found that average and median transaction volumes in the month of Dec 2019 far exceeded the usual average volume by almost 4.2 times! Clearly, there was a marked difference in the transaction volume during the month when Manulife US REIT had been included into the FTSE EPRA Nareit Global Real Estate Index Series.
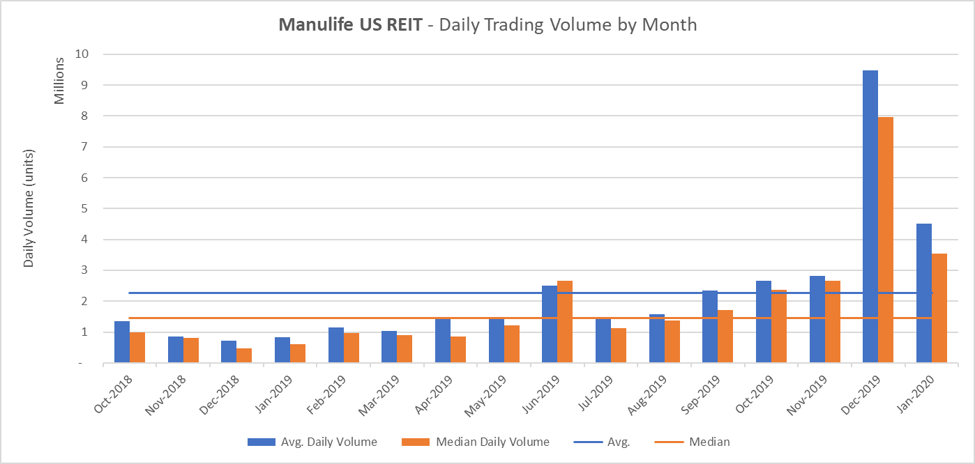
Source: REITScreener Research, ProButterfly Research, Yahoo! Finance - Manulife US REIT
We will further break down the daily transaction volume by day from Oct 2019 to Jan 2020.
We observe from the chart that the transaction volumes are above average since the announcement that Manulife US REIT will be included into the index on 5 Dec 2019. Furthermore, we also observe that on the trading day just before the change of the index constituents took effect (20 Dec 2019), the transaction volume was the highest on record, with a volume of 64.8 million shares that changed hands.
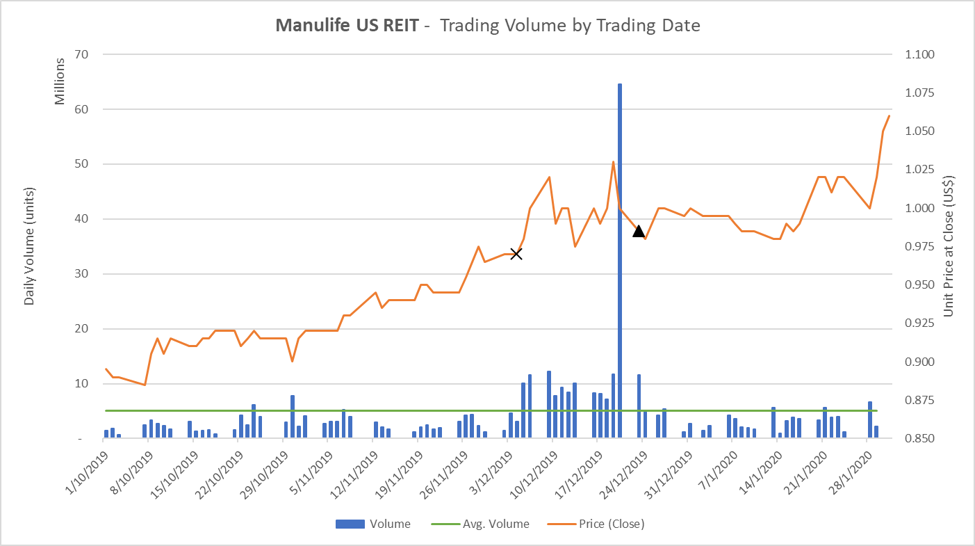
Source: REITScreener Research, ProButterfly Research, Yahoo! Finance - Manulife US REIT
Our hypothesis is that many active fund managers and investors had been buying into Manulife US REIT since the announcement of the index inclusions, ahead of when the index inclusion took effect. The spike in volumes the day just before the index change took effect could be attributed to passive funds making large purchases in order to adjust their portfolio to match the new index components and weightage which resulted in a surge in transaction volume.
Observing the unit price movement, the price had surged from 97c just prior to the announcement to a historical high of $1.08 on on 30 Jan 2020. Post inclusion into the index, the unit price continued to remain elevated with prices trading at $1.07 at the time of writing. Transaction volumes however fell compared to volumes prior to the announcement. Perhaps the active funds and investors had decided to take profit after the surge in prices? This trading strategy has been made famous by the Bloomberg article entitled ‘The Hugely Profitable, Wholly Legal Way to Game the Stock Market’ dated 7 Jul 2015 and we recommend readers to read for complimentary insights along with this article.
Based on our observations of Manulife US REIT, we can conclude that its transaction volume and stock price had indeed shown a noticeable gain with the cause attributed to the index inclusion. While this observation is only based on one stock, similar observations have been made by other traders and investors and have been widely reported in other media. It is known as the “Indexing Effect”.
Conclusion
Inclusion into an established index brings about many benefits for a stock, chiefly the visibility from the recognition. Inclusion into broad-based popular indexes such at the STI, MSCI Singapore, S&P 500 or the Dow would bring about a “blue-chip” status to the stock. The term blue-chip is generally associated with only the largest market capitalisation stocks on the respective stock markets, giving recognition that those firms are well-established and financially sound.
Indexes could also be designed to represent a specific sector of the stock market. For example, the FTSE EPRA Nareit Global REIT Index is an established index that tracks the global REIT market. These indexes usually have passive funds that construct portfolios using the same ratio as their underlying component stocks. If these passive funds are traded on the stock exchange, they are known as ETFs. Any changes in the underlying components would result in all the ETFs tracking that index to adjust their portfolio holdings resulting in buy-ups for inclusions and sell-downs for exclusions.
Besides the passive funds, active funds, institutional and retail investors are also likely to increase participation into a stock due to its inclusion into an index, further injecting even more trading volume and liquidity which leads to more exposure and a wider investor and analyst following, culminating in a virtuous cycle that benefits investors.
Based on the observation of Manulife US REIT and many other stocks that have been included into the index, there is an observable impact in terms of stock price and trading volume.
As a result, the inclusion of Manulife US REIT into an established index series such as the FTSE EPRA Nareit Global Developed Index series brings about significant benefits to investors including recognition due to its outperformance, higher volumes, increased trading liquidity, and short-term buying up by passive funds. In the longer term, stocks included into the index would enjoy greater analyst and investor following while actively managed funds will also increasingly trade them due to increased visibility and coverage.
For Manulife US REIT, the next potential index inclusion will be the MSCI Singapore Index, which has more stringent requirements. One of the criteria for entry is a market cap of approximately S$5.0 billion. We trust that in the coming years, we would see Manulife US REIT grow to surpass this benchmark and be recognised among the titans of the Singapore market.
This article was first appeared on ProButterfly.com.