Portfolio
Portfolio Overview
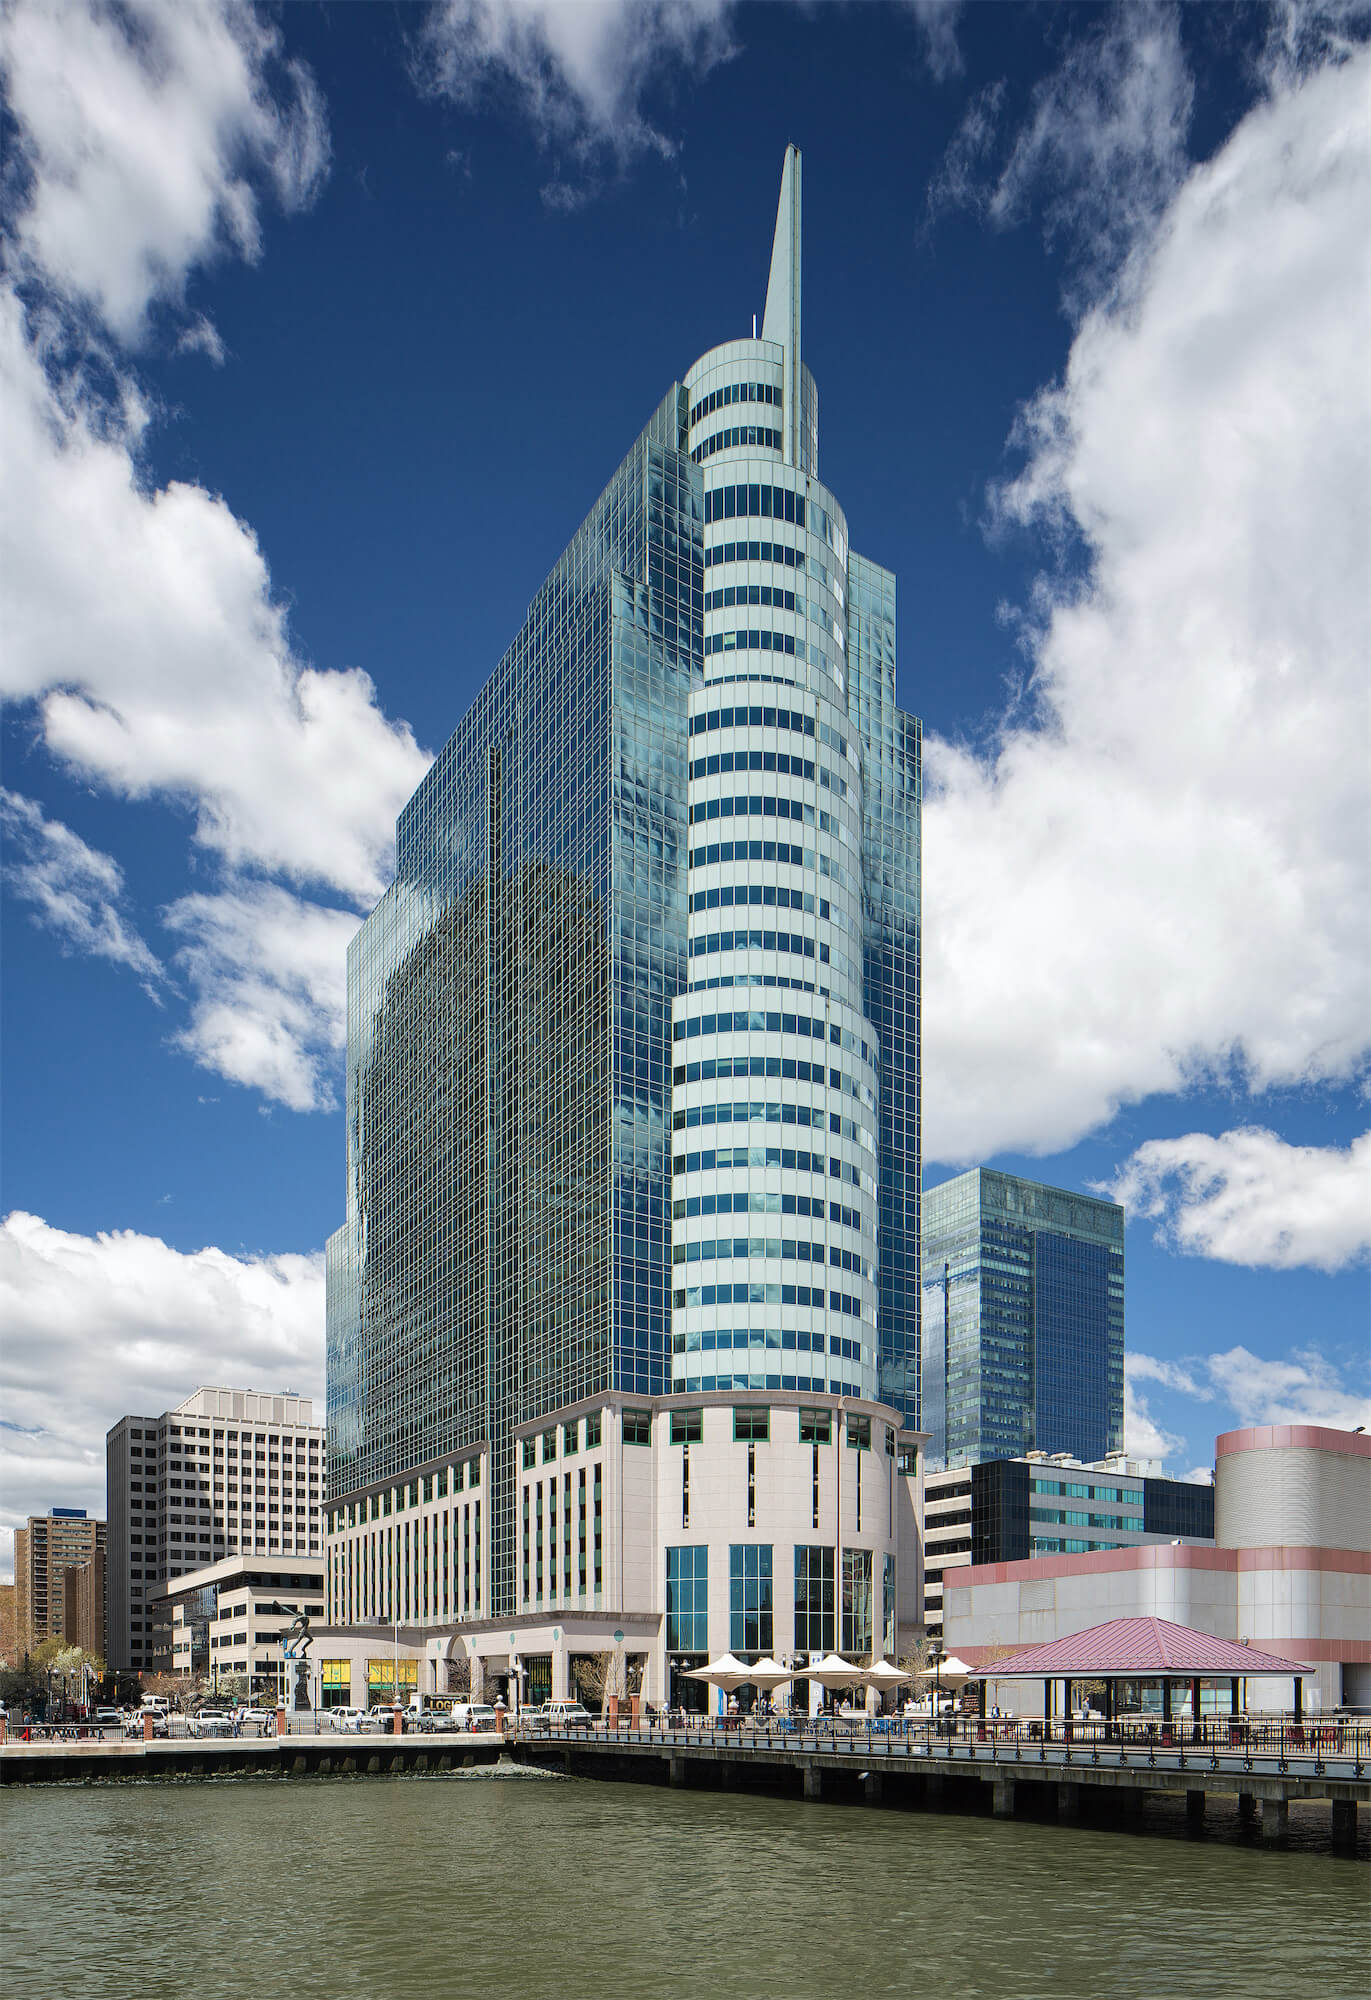
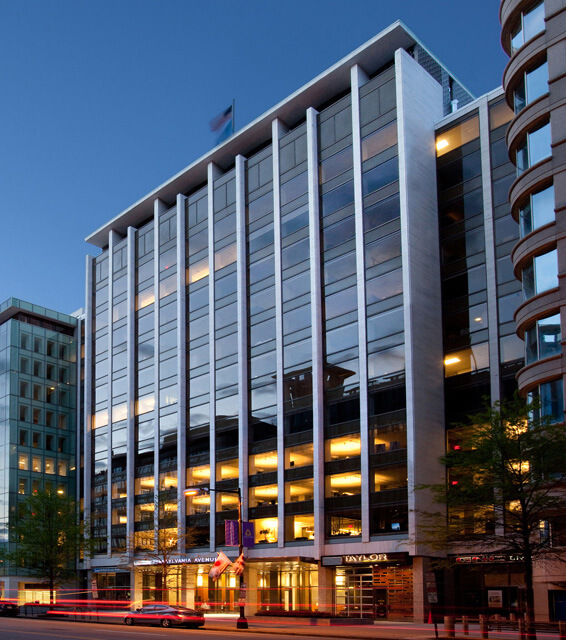
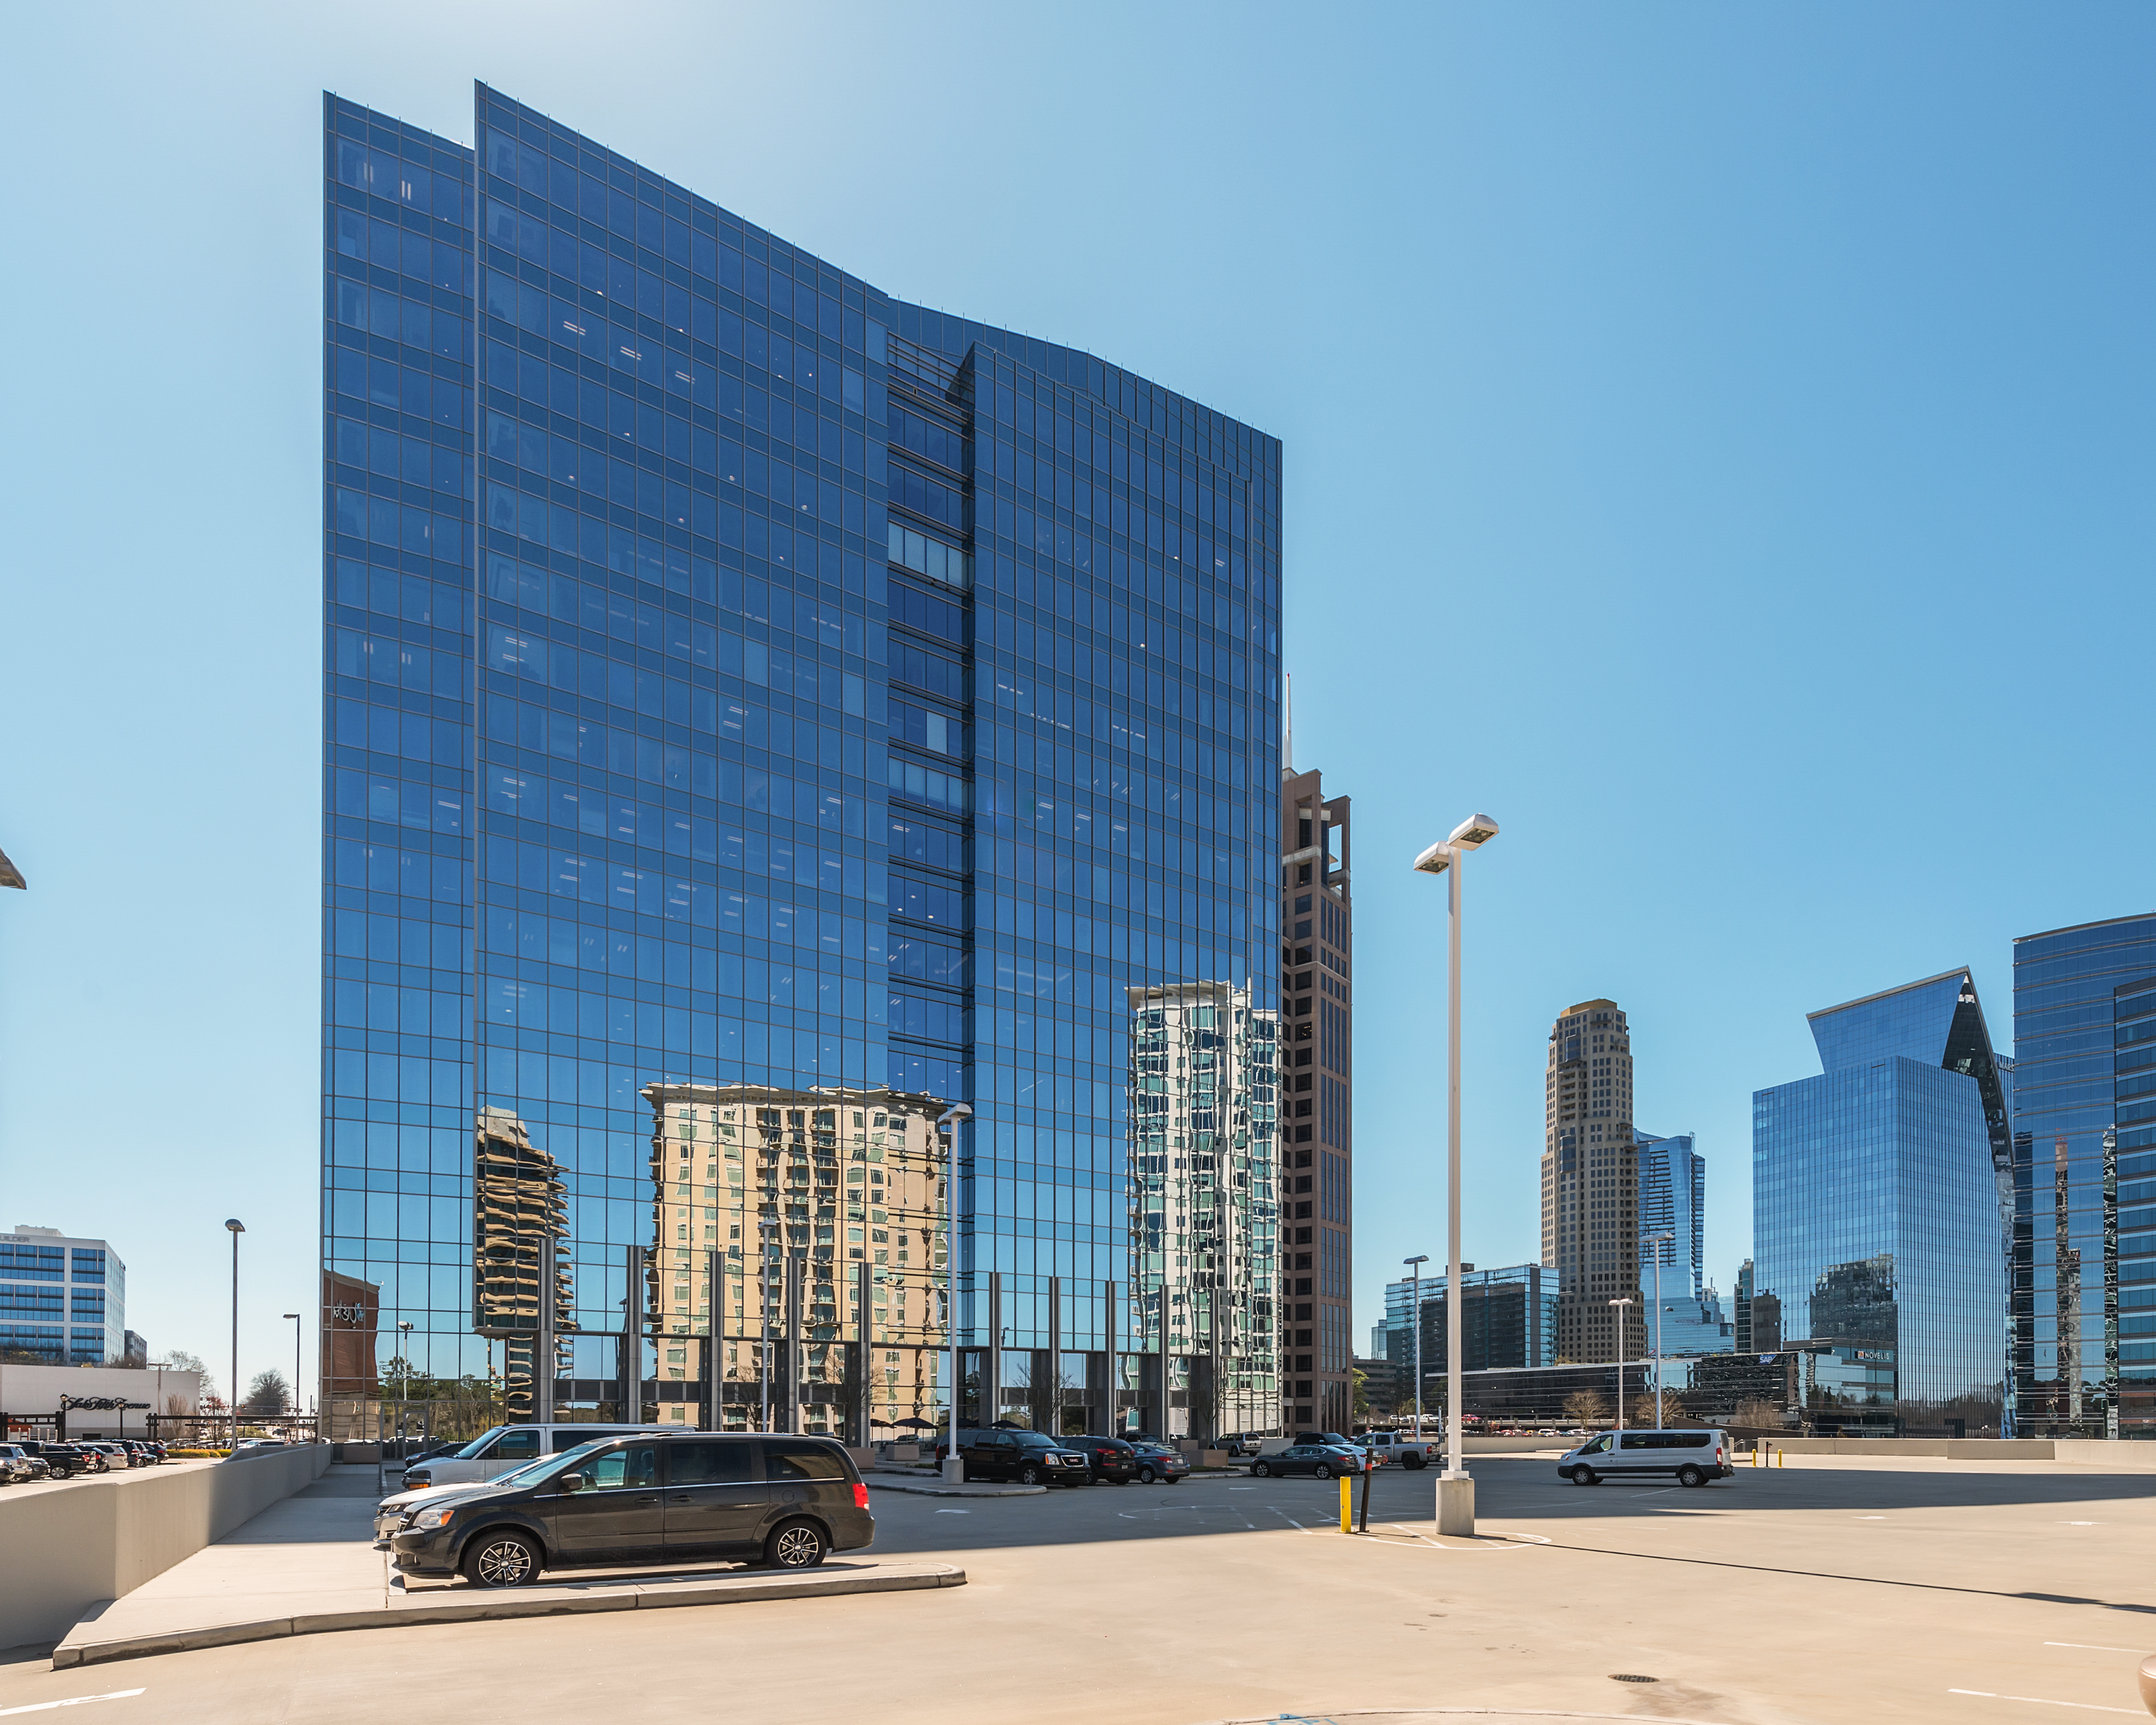
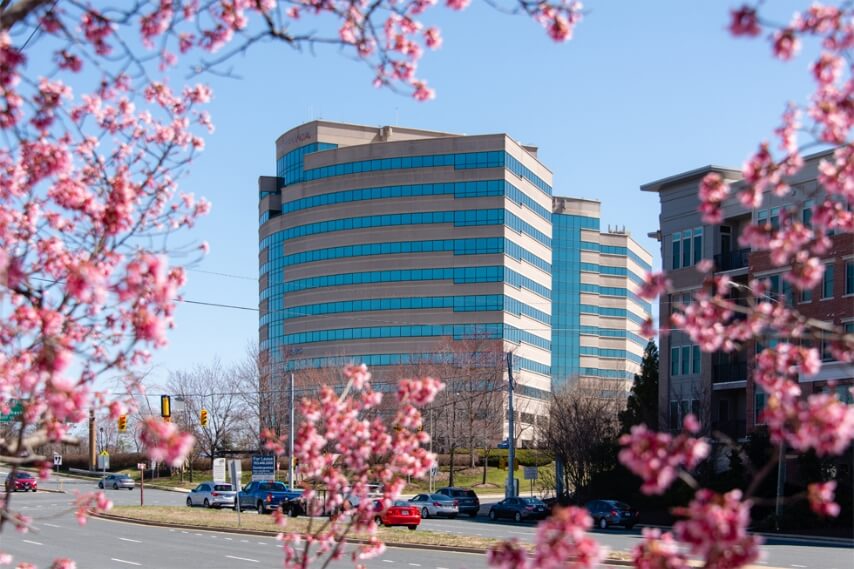
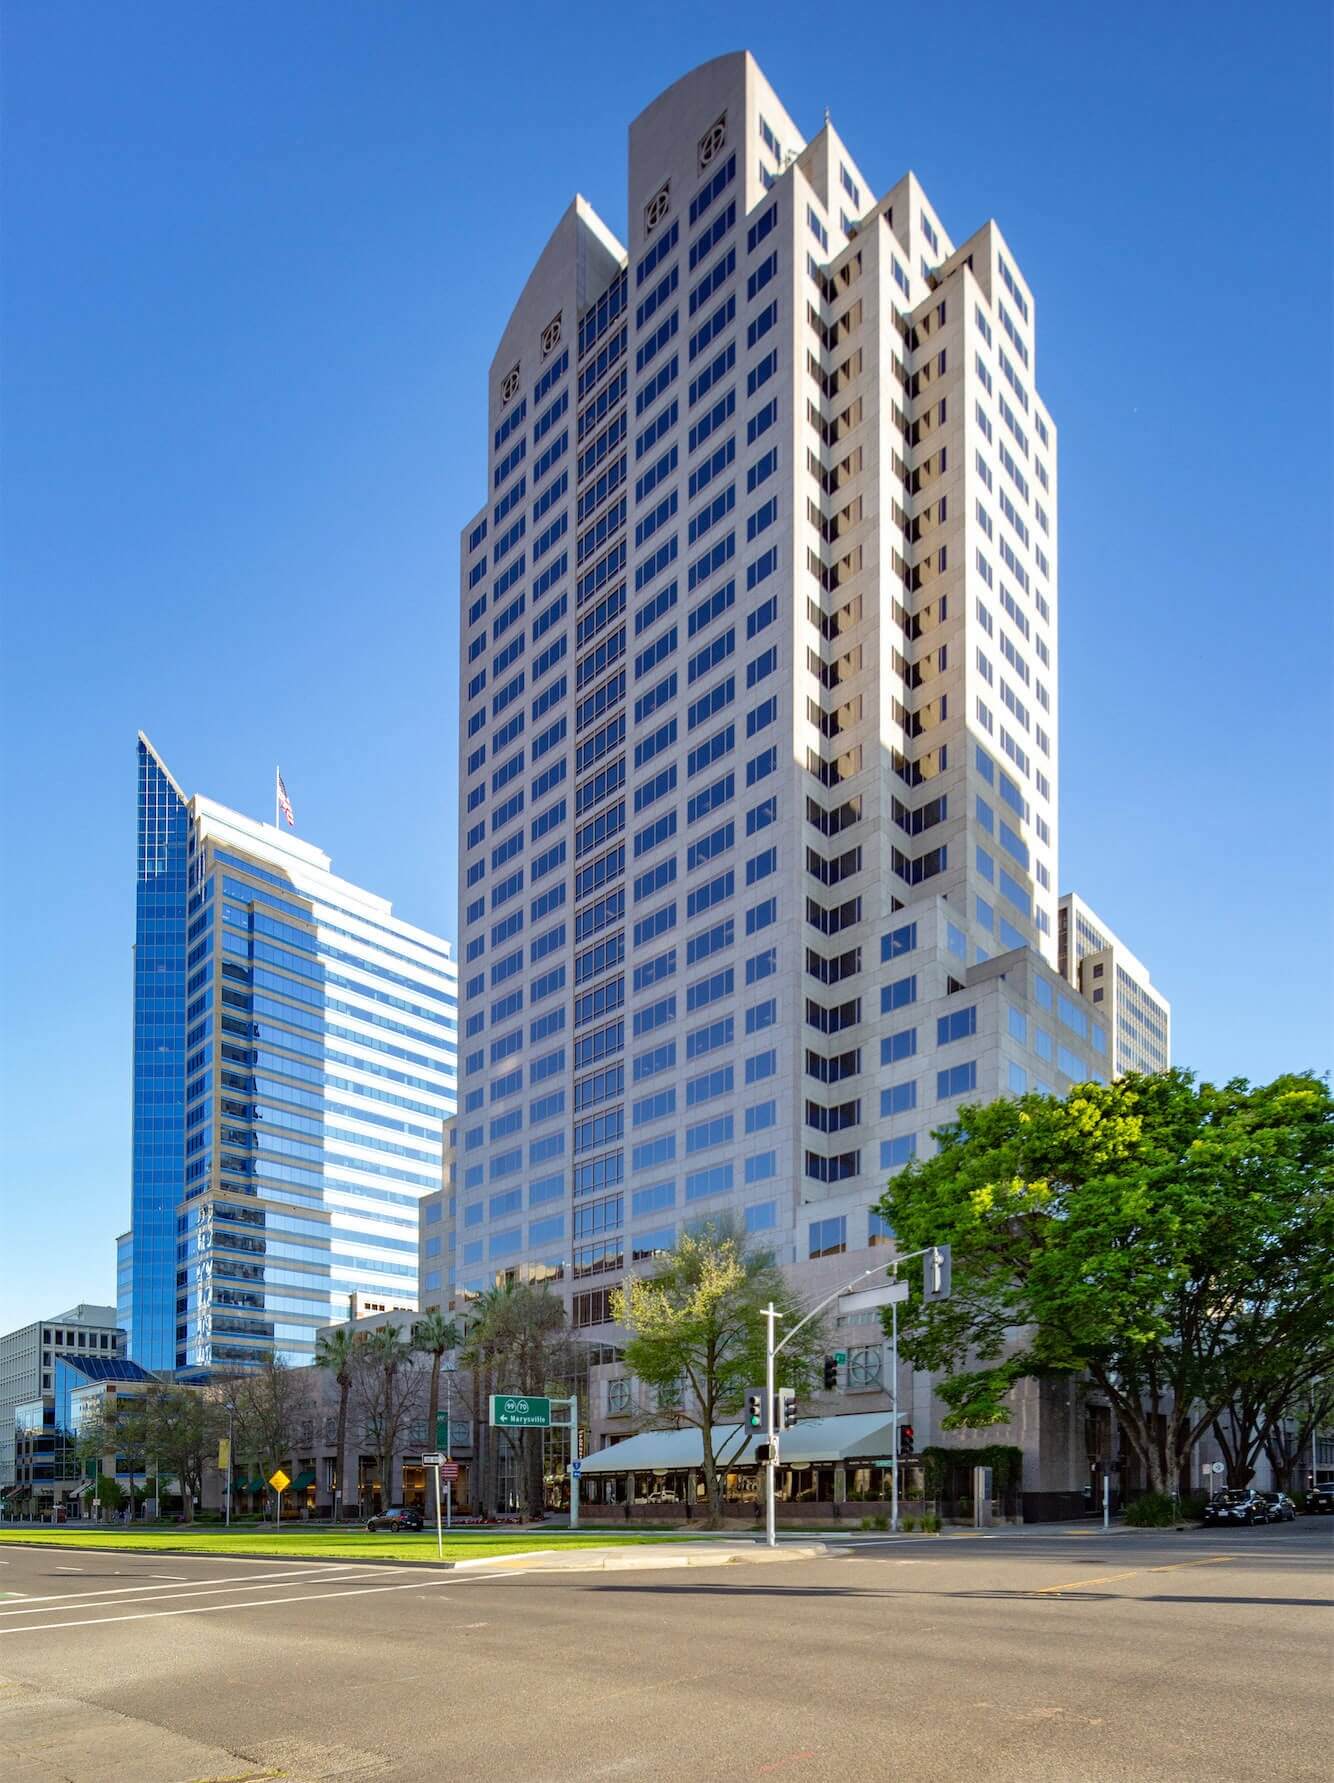
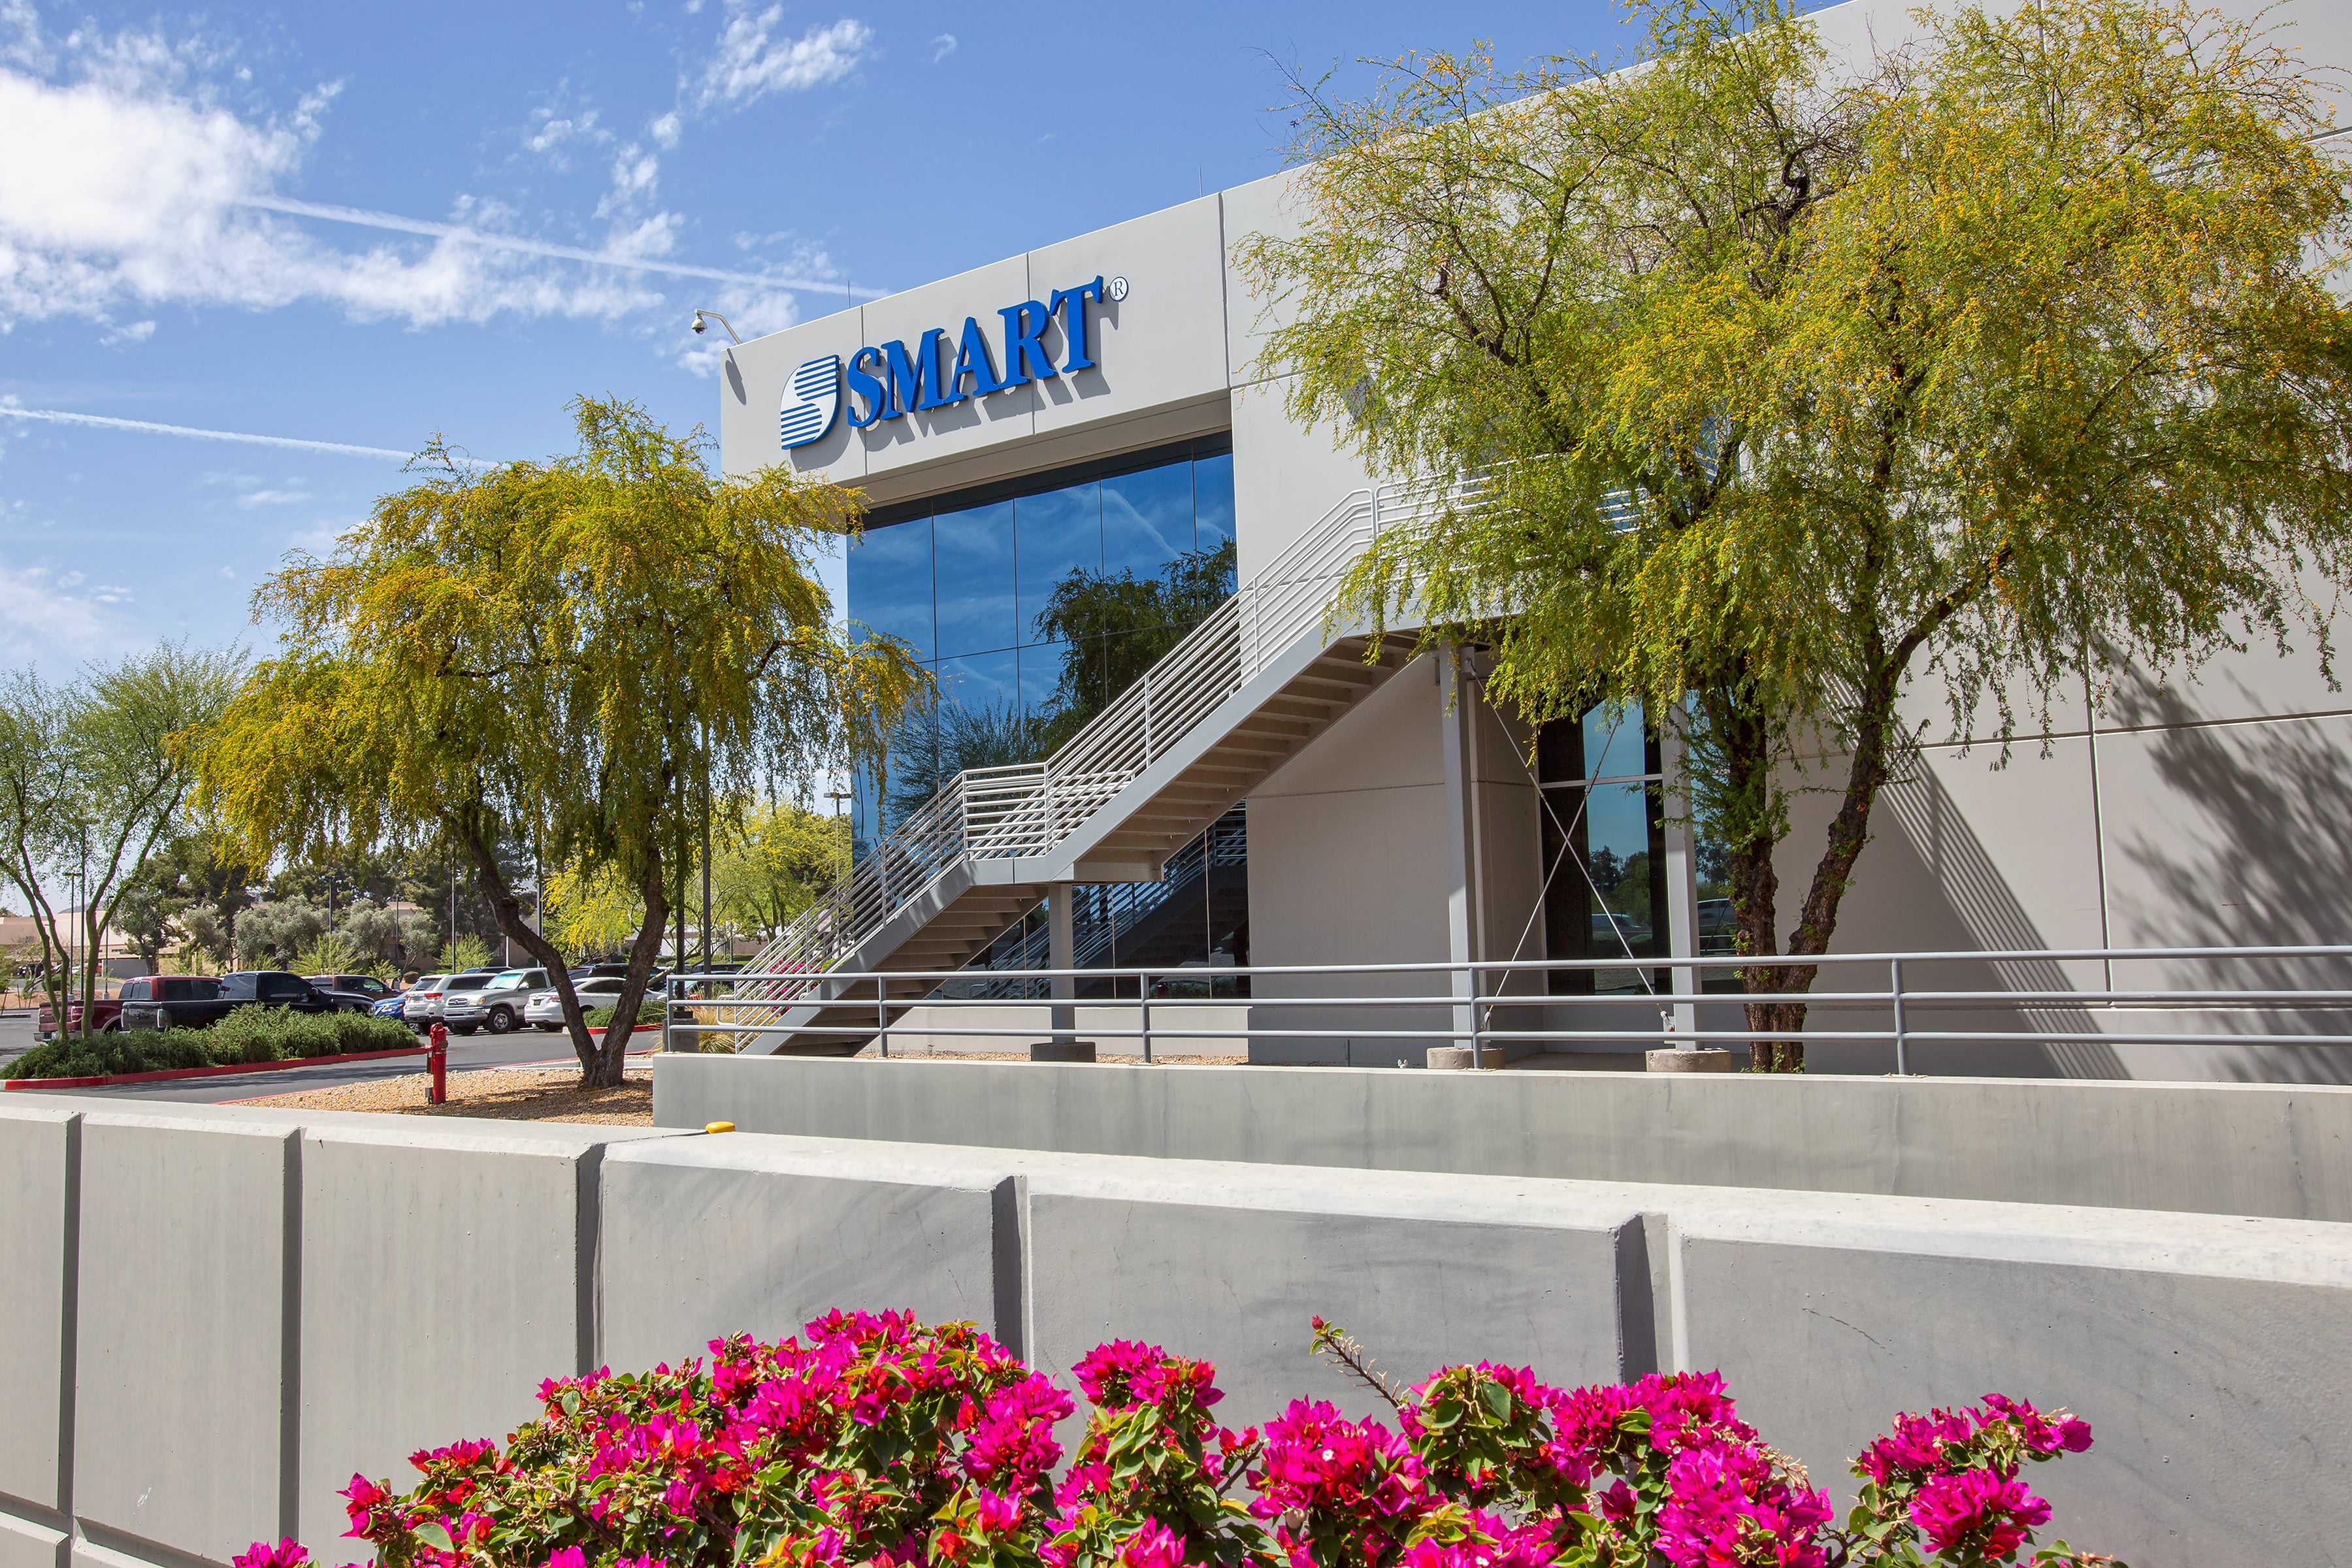
As at 31 March 2024, Manulife US REIT’s portfolio comprises of 10 office properties in the United States, with an aggregate net lettable area of 5.0 million sq ft. The 10 freehold office properties are strategically located in Arizona, California, Georgia, New Jersey, Virginia and Washington, D.C.
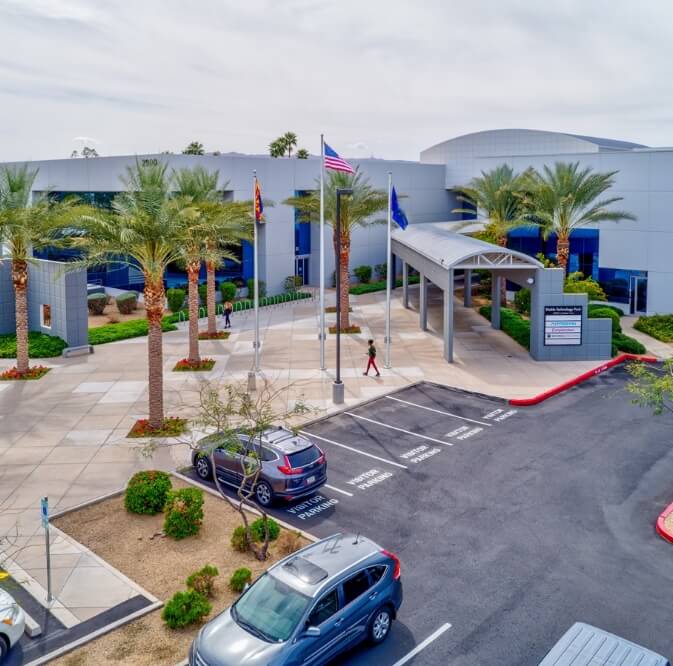
As at 31 December 2023, Manulife US REIT’s portfolio comprises of 10 office properties in the United States, with an aggregate net lettable area of 5.0 million sq ft. The 10 freehold office properties are strategically located in Arizona, California, Georgia, New Jersey, Virginia and Washington, D.C.

years
WALE by NLA

%
Occupancy

Freehold
Land Tenure

Number of Tenants
As at 31 March 2024
Our Properties
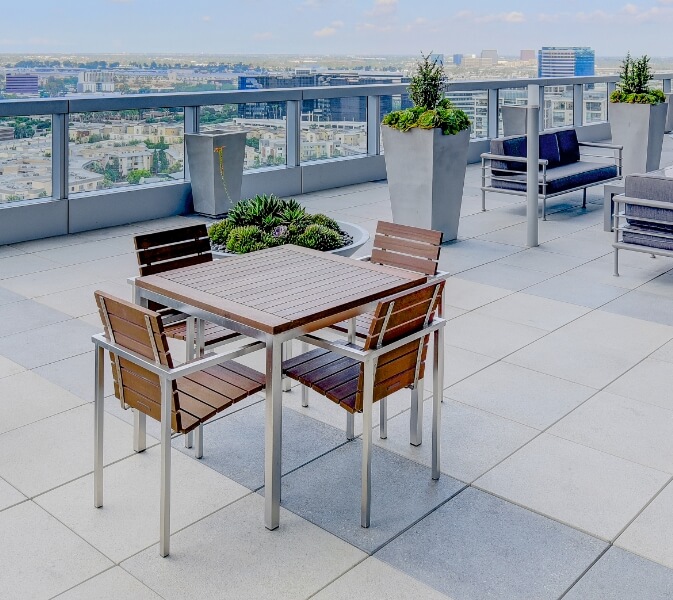
Portfolio Statistics

| As at 31 Dec 2023 | Location | Completion Year |
NLA (sq ft) | Valuation (US$ million) |
WALE by NLA (years) |
No. of Tenants |
Occupancy (%) |
|---|---|---|---|---|---|---|---|
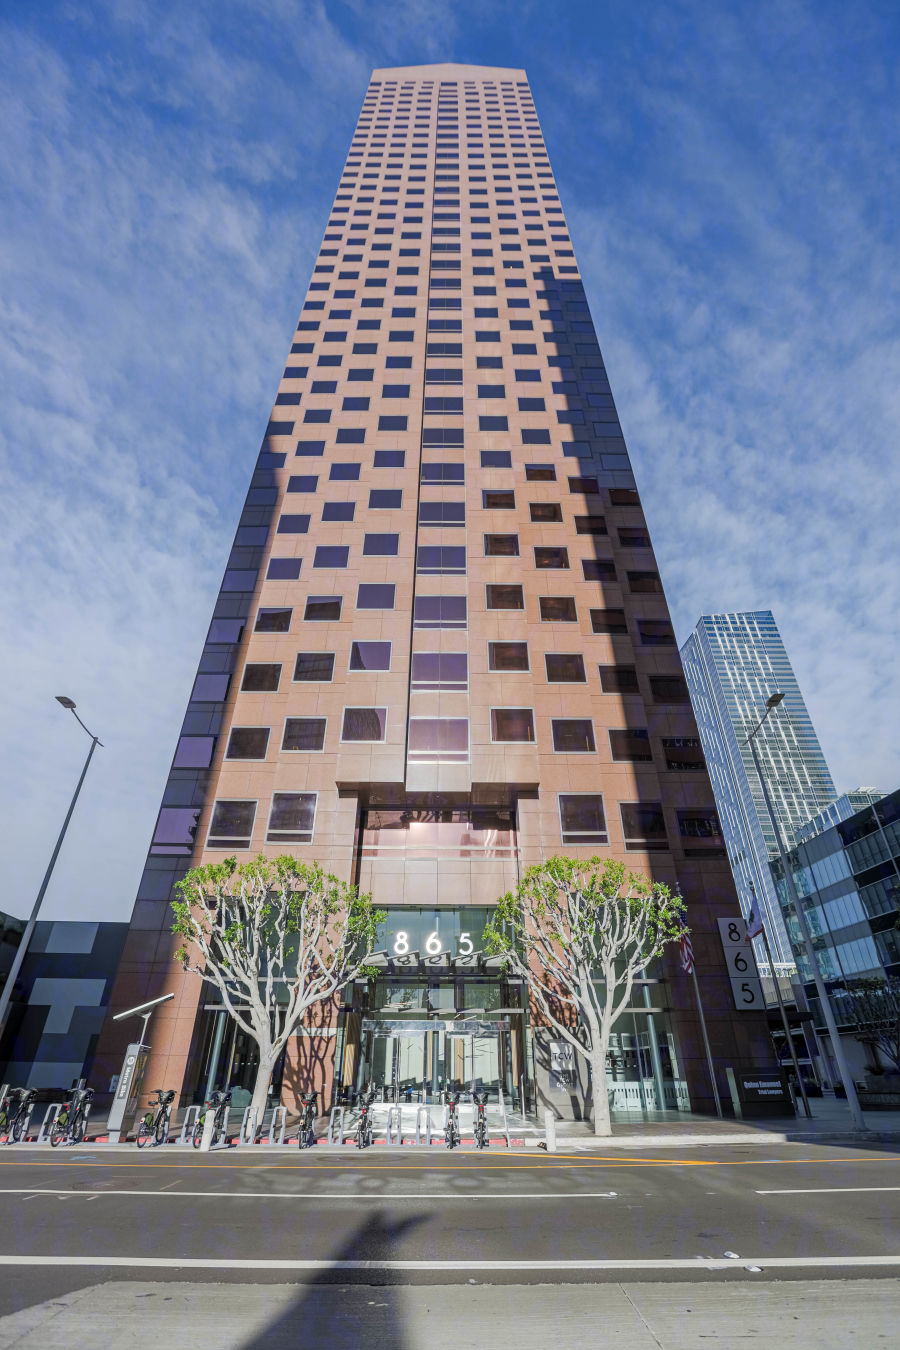
| Figueroa | Los Angeles | 1991 | 715,024 | 139.0 | 3.4 | 24 | 81.9 |
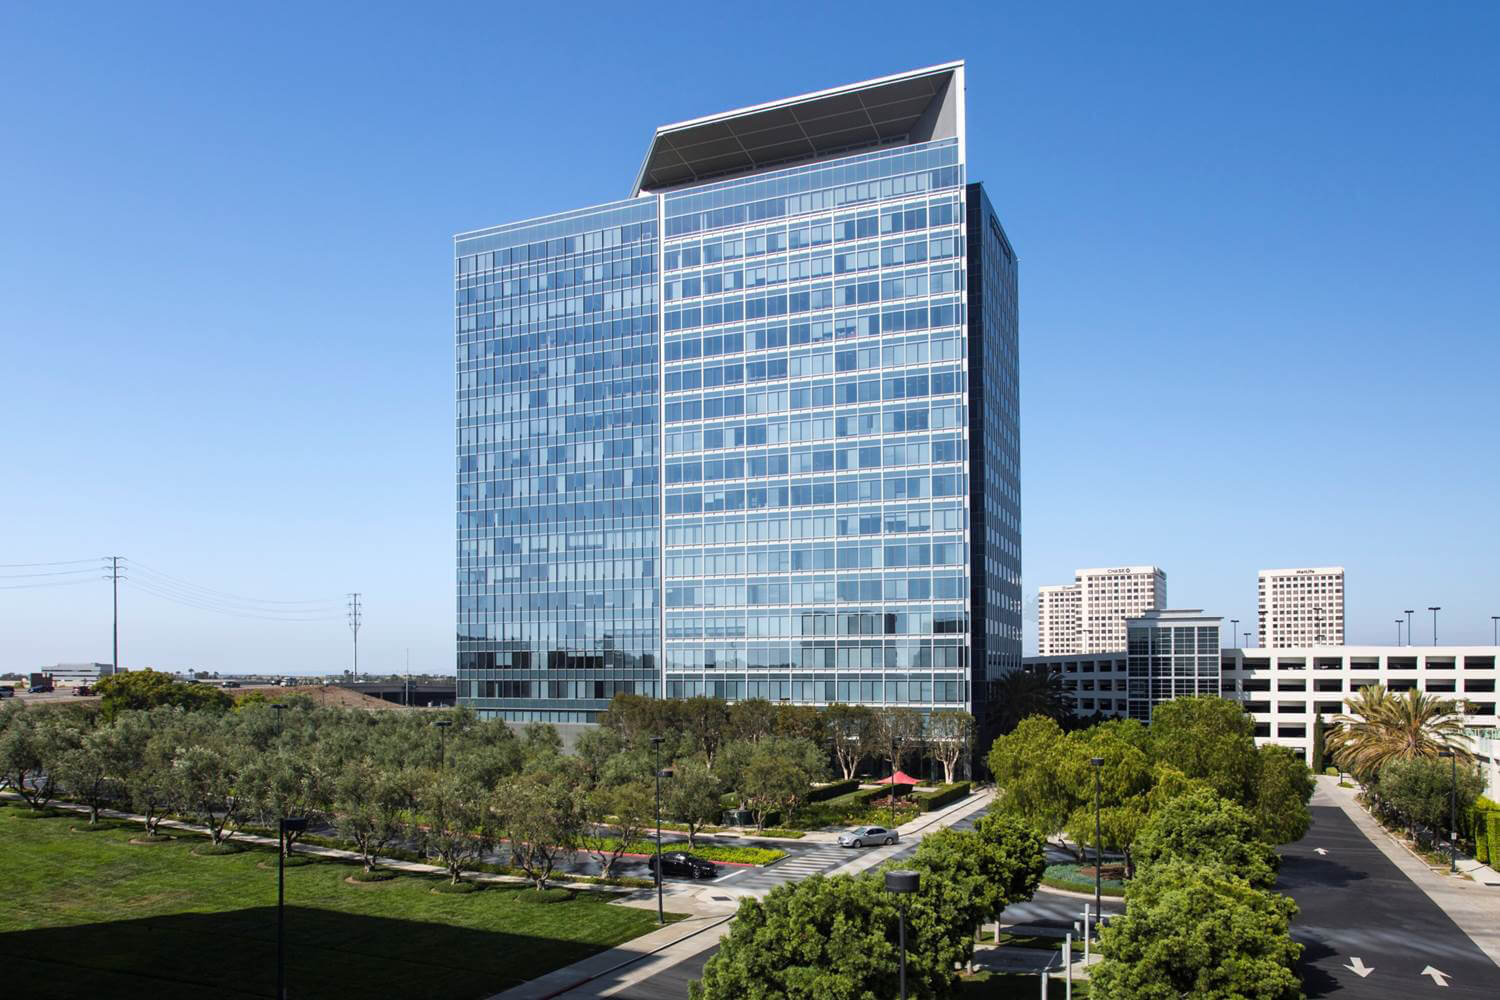
| Michelson | Irvine | 2007 | 535,003 | 240.0 | 5.7 | 18 | 83.3 |
| Peachtree | Atlanta | 1991 | 559,176 | 171.0 | 6.2 | 24 | 78.9 |
| Plaza | Secaucus | 1985 | 466,496 | 58.0 | 3.9 | 6 | 83.4 |
| Exchange | Jersey City | 1988 | 737,611 | 234.0 | 4.4 | 23 | 86.6 |
| Penn | Washington, D.C. | 1964 | 278,063 | 108.0 | 3.6 | 8 | 90.9 |
| Phipps | Atlanta | 2010 | 475,778 | 176.0 | 8.8 | 10 | 78.8 |
| Centerpointe | Virginia | 1987/1989 | 421,188 | 75.8 | 3.1 | 18 | 86.4 |
| Capitol | Sacramento | 1992 | 502,454 | 158.0 | 5.4 | 38 | 86.6 |
| Diablo | Tempe | 1980-1998 | 335,385 | 52.0 | 2.0 | 7 | 93.7 |


